Analysis · Environment & Climate
A stronger El Niño is not a local winter forecast
NOAA’s November update puts high odds on a powerful Pacific event—but confidence in its strength does not guarantee a particular US winter.

NOAA’s latest El Niño assessment supports a strong conclusion about the tropical Pacific, not a guaranteed outcome for anyone’s winter. Its November 12 discussion puts the probability of a strong-to-very strong event through January–March 2027 above 79%, while explicitly warning that even a very strong event does not guarantee impacts consistent with El Niño. Those statements are complementary, not contradictory: confidence depends on what is being predicted.
The NOAA Climate Prediction Center’s outlook anticipates further strengthening before weakening in early 2027. That is consequential information about a major climate influence. It is not, by itself, a forecast of snowfall in a particular city or winter rainfall in a particular watershed.
Three questions need to remain separate: how strong the Pacific event becomes, how warm the planet is, and what weather a US region experiences. This week’s institutional updates address different parts of that picture.
What the Pacific assessment measures
El Niño is the warm phase of the El Niño–Southern Oscillation, a coupled ocean–atmosphere pattern. Sea-surface temperatures matter, but so do the winds and tropical rainfall associated with them. An ocean anomaly becomes climatically important partly through how the atmosphere responds.
The mechanism is physical, not merely a statistical association. Changes in tropical ocean warmth can shift where air rises and releases heat through condensation. Those shifts influence atmospheric circulation, potentially altering jet streams and storm tracks far from the equatorial Pacific. The connection is real; its regional expression is variable.
An ENSO assessment therefore draws on ocean observations, atmospheric conditions and forecasts. Surface temperatures describe one part of the current state; subsurface warmth helps reveal the ocean’s capacity to sustain or change that state. Winds and convection indicate how the atmosphere is participating. Models then estimate how the coupled system may evolve.
NOAA’s November outlook synthesizes multiple models rather than treating one simulation as the answer. Agreement across models can strengthen confidence, but it does not eliminate uncertainty. Models may share assumptions and errors, and an ensemble—a collection of simulations—is not a set of fully independent experiments. Its spread helps describe possible outcomes without necessarily capturing every source of uncertainty.
The headline probability also has a defined target: event strength over specified seasonal periods. It is not the probability that a familiar El Niño weather pattern will occur at every location.
Why greater strength does not settle regional weather
A stronger tropical Pacific signal can make some broad atmospheric responses more likely. Yet the route from ocean warmth to local weather contains several additional steps. The geographical pattern of warming matters, as does the interaction with other ocean conditions and atmospheric variability.
Seasonal weather also contains considerable internal variability: circulation changes that cannot be inferred from El Niño’s strength alone. A handful of storm tracks can make a large difference to one region’s precipitation total. Snowfall additionally depends on temperatures when precipitation occurs, not simply on whether a season is wetter overall.
Historical comparisons help establish recurring relationships, but their limitations matter. The sample of very strong events is necessarily smaller than the sample of all winters. No two events occur against identical background conditions. A historical composite—the average across selected events—can reveal a tendency while concealing substantial differences between individual seasons.
Replication here means looking for a relationship across events, datasets and forecasting methods, not expecting the same winter to repeat. A pattern that appears in an average is not a script for the next event.
That is why NOAA’s explicit warning about non-guaranteed impacts belongs beside the strength estimate, not in a footnote. The available evidence does not support approving a deterministic local winter prediction. Regional outlooks require their own probabilities, geographical boundaries and verification; the ENSO strength estimate cannot substitute for them.
Global heat is a different measurement
The global-temperature updates released this week provide important context, but they are not additional measurements of El Niño’s strength.
Copernicus reported on November 11 that October 2026 averaged 15.35°C globally, an estimated 1.75°C above the 1850–1900 baseline and the warmest October in its record. This describes one month at global scale. It does not describe the temperature anomaly in an ENSO monitoring region.
Copernicus also gives 2026 about a one-in-five chance of tying or exceeding 2024’s annual temperature record. That is a forecast from a statistical model using ERA5 data through October, not a completed annual observation. ERA5 is a reanalysis: observations combined with a physical model to construct a consistent account of atmospheric conditions.
The distinction between a measured period and a forecast extension matters. October has ended; November and December have not. A probability for the annual ranking acknowledges that the remaining months can still affect the result.
Nor should Pacific indices and global anomalies be compared simply because both use degrees Celsius. They describe different geographical areas, reference conditions and, potentially, averaging periods. Different Niño indices likewise cannot be treated as interchangeable without checking their definitions.
El Niño can influence global surface temperatures through changes in ocean–atmosphere heat exchange. It operates alongside the long-term warming driven by human greenhouse-gas emissions. But these updates do not quantify how much of October’s global anomaly is attributable to this event. Assigning a share would require a separate attribution analysis.
Why WMO’s estimate is not a competing number
The World Meteorological Organization’s November 9 COP31 update puts the January–September global surface-temperature estimate at about 1.47°C above the 1850–1900 average. Its coverage extends through September where data are available and explicitly does not capture the most recent El Niño impacts.
There is no contradiction between that nine-month estimate and Copernicus’s higher October anomaly. They describe different observation windows. Subtracting one from the other would not measure a month-to-month temperature jump, because January–September is an average, not September alone.
WMO also reports that preliminary ocean-heat data through July point toward a tenth consecutive record year. Ocean heat content measures stored heat, rather than simply surface temperature. Both the preliminary status and the July cutoff belong with the finding; the annual result is not yet finalized.
These global indicators inform the wider climate discussion, including the COP31 debate over impacts on cities and vulnerable communities. They do not resolve the regional winter forecast.
The conclusion—and its boundary
NOAA’s assessment supports high confidence in a strong Pacific event, with uncertainty about its evolution and regional consequences. Copernicus and WMO document global warmth across distinct periods, alongside forecasts and preliminary findings that must retain those labels.
The unresolved question is not whether El Niño matters. It is how this event’s ocean pattern and atmospheric response will combine with other influences in particular regions. Strong evidence at one scale does not automatically become strong evidence at another. Keeping that boundary visible is the central requirement for interpreting the winter outlook honestly.
Sources and References
Spotted an error? Request a correction · Corrections Policy
Related stories

‘We’re assuming it’s going to be a lot smellier this year’: Pete the corpse flower prepares to bloom in Geelong
The 178cm plant is expected to unfurl as early as Sunday and release its signature scent of rotting flesh and ‘possum urine’ Get our breaking news email , free app or daily news podcast Geelong botanic gardens is preparing for its second corpse flower bloom in two years – a normally rare event that has been dubbed a “smelly sequel” . The flower, which broke through soil at the end of September, has been rapidly…
The Guardian ·
COP31: Protesters, UN urge swift climate deal
The UN climate chief warned that "tactical delays" at the COP31 climate talks in Turkey could prevent a deal to slow global warming.
Deutsche Welle ·
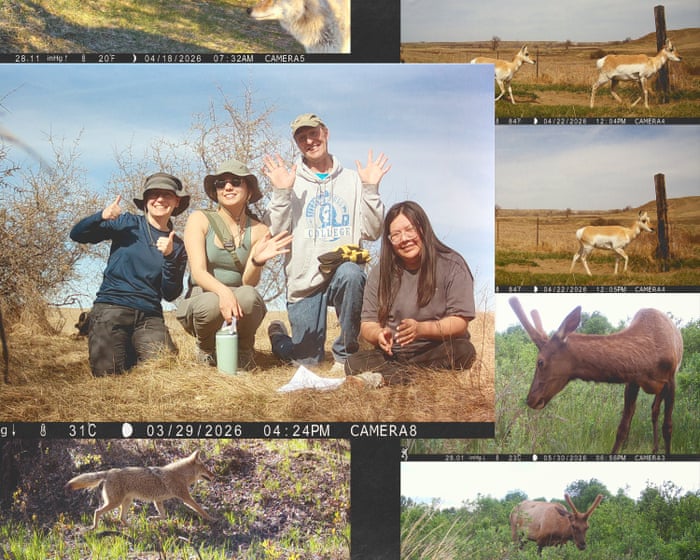
Indigenous students retrace Lewis and Clark’s historic journey: ‘We can’t protect what we cannot see’
Two centuries after the expedition, Indigenous students are conducting a new wildlife survey along the route In 1804, when Thomas Jefferson dispatched Meriwether Lewis and William Clark and their Corps of Discovery to explore the newly acquired land west of the Mississippi, the president’s primary aim was political: Americans needed to establish presence, power and trade routes in these territories before the…
The Guardian ·

‘It’s an architect’s dream’: five beautiful eco buildings around the world
From a bamboo gym in Bali to a house made from earth in Wiltshire, these projects show the beauty in sustainable design With construction accounting for more than a third of global emissions, sustainable architecture is central to the world meeting its climate targets. The following five creations from around the world exemplify how “green” buildings can also be beautiful. Children’s Village, Tocantins, Brazil…
The Guardian ·
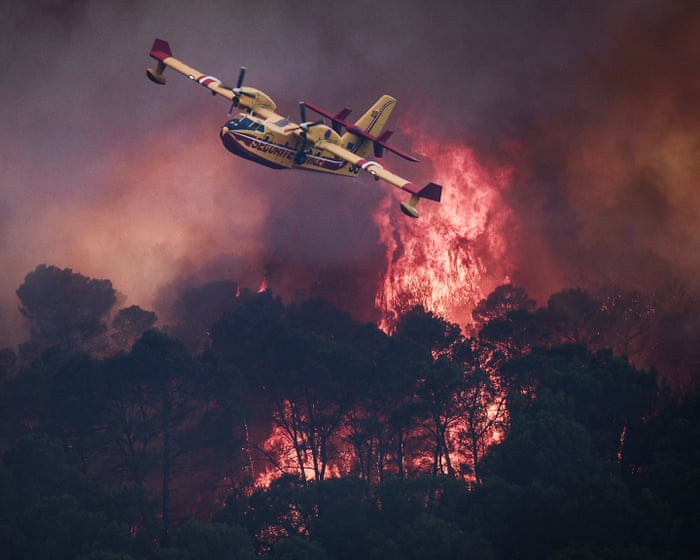
Choking fires, deadly heat and devastating floods: 2026 in extreme weather
People around the world have contended with unprecedented weather events and their fatal effects caused by the climate catastrophe After the world’s hottest summer since records began in 1850, the death toll from extreme weather in 2026 is already in the high tens of thousands. That is a conservative estimate and is certain to rise much higher. As Cop31 continues and scientists warn that climate breakdown may be…
The Guardian ·
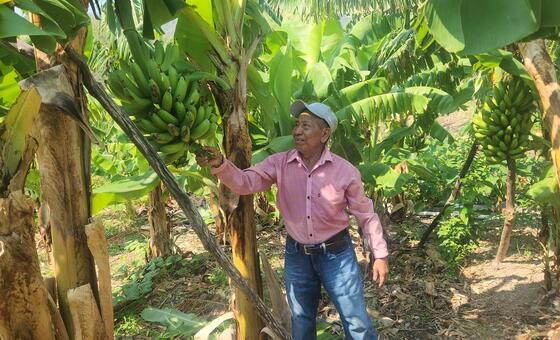
When the rains fail: Preparing for drought in Central America
Across Central America’s so-called Dry Corridor, farming families live at the mercy of the rains. In southwestern Honduras, Anastacio Martínez Gómez has spent most of his 73 years learning to work the land. But experience can only take him so far.
United Nations ·